Arctic Max/Min Temps Chart
Posted
I often try and do what’s right for the environment. Many times it’s hard to stay on top of it. But just like anything else, it’s really getting into the habbit of someting in order to make it stick. As such, our family has worked hard to ensure we make the changes needed in order to help impact global climate change. Whether it’s taking the bike down the street to Aldi’s instead of driving or turning the water off when soaping during a shower, we try our best.
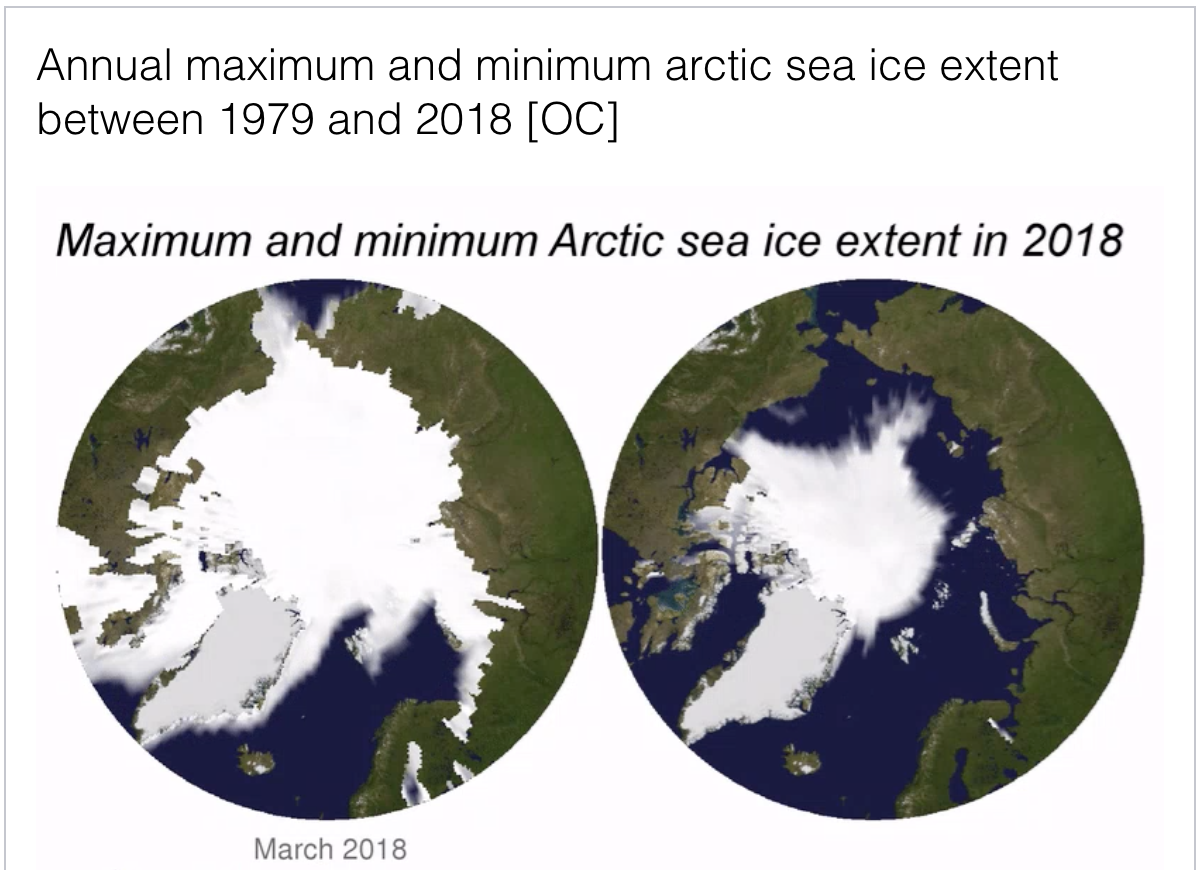
This graphic below is a great story on what time has done to our Arctic. Looking at the maximum temp, there isn’t much of a change, but when looking at the minimum temp in September since 1979 you can really spot the difference.
Annual maximum and minimum arctic sea ice extent between 1979 and 2018 [OC] from r/dataisbeautiful
Yes this chart is lacking the density or depth of the ice, but it’s still a nice representation of what has happened over the years.
There are times when I think “Is what I’m doing even making a difference?” And the answer is yes! As long as we do our part and share with others, I beleive we can slowly make a difference in the long run.